Currency Pairs: All.
Time Frame: 60 min.
Indicators:
That’s all there is to it. Once you have your 5minute chart, there is no need to open a 15 minute and a 30 minute chart. I normally just change the time frame to 30 minutes and 15 minutes before I start trading to determine the trend. I then go back to the 5 minute chart to look for trade setups.
Short Entry
2. The 10 EMA should be below the 144 EMA on all time frames.
3. Price must be below the 10 EMA on the 5 minute chart.
5. Wait for price to retrace to the 10 EMA on the 5 minute chart.
6. When the price retraces or comes extremely close to the 10 EMA on the 5 minute chart, enter the trade.
7. Stay in the trade and follow the trend until there is an indication that the trend may be reversing, at which point, look to exit the trade. Exit the trade when price closes above the trend signal line (144 EMA - purple) on either the 5, 15 or 30 minute charts depending on your risk tolerance. Alternatively, you may exit when your TakeProfit of 3-50 pips has been reached.

The red horizontal line on the image above shows the current candle we are looking at. At this point, the price is below the 144 EMA on all 3 time frames, i.e. the 30 minute, 15 minute
and 5 minute charts.
The 10 EMA is also below the 144 EMA on all time frames. As you can see, price is below the 10 EMA on the 5 minute chart above.
Price has closed below the 10 EMA on the 5 minute chart over the previous 2-3 bars so I waited for price to retrace to the 10 EMA on the 5 minute chart. The price then retraced or
came extremely close to the 10 EMA on the 5 minute chart so I looked to enter the trade.
I will remain in the trade and follow the trend until 3-50 pips has been reached or if I see an indication that the trend may be reversing, at which point I will look to exit the trade. That is
usually when price closes above my trend signal line (144 EMA – purple).

Above is another 5 minute chart. The price is below the 144 EMA on all 3 time frames (30 minute, 15 minute and 5 minute charts).
You can see that the 10 EMA is below the 144 EMA on all time frames. The price is also below the 10 EMA on the 5 minute chart.
After the price has closed below the 10 EMA on the 5 minute chart over the previous 2-3 bars, I waited for price to retrace to the 10 EMA. As soon as the price retraced and came extremely close to the 10 EMA, I looked to enter the trade.
I remained in the trade and followed the trend until my target of 3-50 pips had been reached
Long Entry
1. Price must be above the 144 EMA on all 3 time frames: 30 minute, 15 minute and 5 minute charts.
2. The 10 EMA (exponential moving average) should be above the 144 EMA on all time frames.
3. Price must be above the 10 EMA on the 5 minute chart.
4. Wait 2-3 bars for price to close above the 10 EMA (exponential moving average)on the 5 minute chart.
5. Wait for price to retrace to the 10 EMA on the 5 minute chart.
6. When the price retraces or comes extremely close to the 10 EMA on the 5 minute chart, enter the trade.
7. Stay in the trade and follow the trend until there is an indication that the trend may be reversing, at which point, look to exit the trade. Exit when price closes below the
trend signal line (144 EMA - purple) on either the 5, 15 or 30 minute charts depending on your risk tolerance. Alternatively, you may exit when the Take Profit of 3-50 pips has been reached.
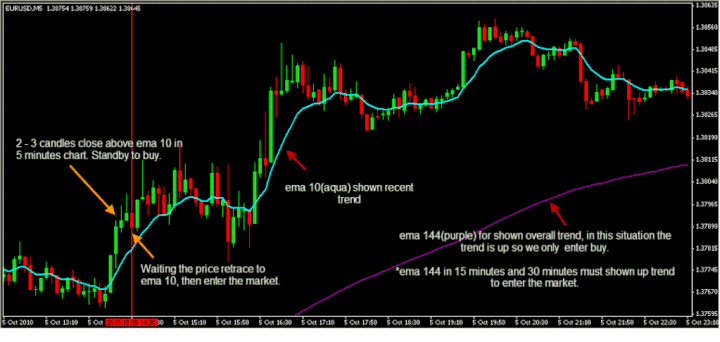
The red horizontal line on the image above shows the current candle we are looking at. At this point, the price is above the 144 EMA on all 3 time frames, i.e. the 30 minute, 15 minute
and 5 minute charts.
The 10 EMA is also above the 144 EMA on all time frames. As you can see, price is above the 10 EMA on the 5 minute chart.
Price has closed above the 10 EMA on the 5 minute chart over the previous 2-3 bars, so I waited for price to retrace to the 10 EMA. The price then retraced or came extremely close
to the 10 EMA on the 5 minute chart so I entered a buy trade.
My target of 3-50 pips has been reached so I exited the trade.
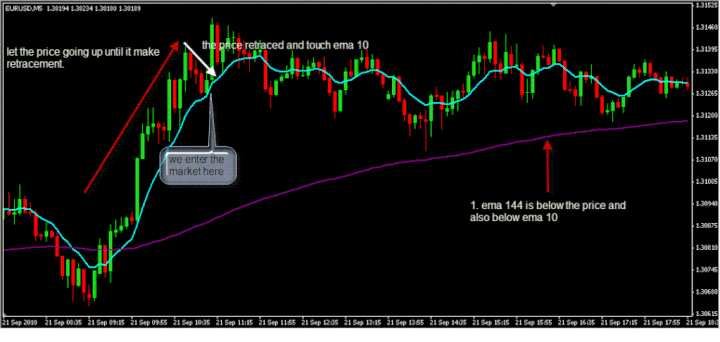
We have another 5 minute chart above. Once I have made sure that the price is above the 144 EMA(exponential moving average) on all 3 time frames (30 minute, 15 minute and 5 minute charts), I will look at the 10 EMA (exponential moving average) and make sure that it is also above the 144 EMA on all time frames.
Once that’s done, I looked at the price and checked if it is above the 10 EMA (exponential moving average) on the 5 minute chart.
When the price has closed above the 10 EMA on the 5 minute chart over the previous 2-3 bars, I waited for price to retrace to the 10 EMA. The price then retraced and came extremely close to the 10 EMA on the 5 minute chart so I looked to enter the trade.
I remained in the trade and followed the trend until my target of 3-50 pips had been reached.
source;http://www.forexstrategiesresources.com/trend-following-forex-strategies/76-ema-s-retracement/
Post a Comment