 Lets be honest, most traders LOVE indicators – there is always an element of excitement when you discover a new shiny tool to tinker with on your charts.
But, the real truth is – everyone is searching for a fictitious “holy grail indicator” that is going to remove the anxiety from trade decision making.
As you probably know all too well, this develops into a love/hate relationship when nothing lives up to your expectations. Then escalates into a vicious hunt for the “perfect indicator” – expending a lot of wasted energy.
Now, at some point in your trading journey, you’re going to say to yourself: “I want to learn how to trade without indicators!”
Regardless of what has led you to this point, this new quest for knowledge will generally lead you down the path to price action trading.
Price action is a methodology, a skill of reading the naked candlesticks directly. As a price action trader you base your decisions purely on what price is doing right now, compared to what it has done in the past.
Today, I would like to arm you with some kick-starter knowledge to usher you into indicator free trading with a simple step-by-step guide to making sense of a price chart – finally extinguishing that dead-end search for holy grail accessories.
For those who are already active price action traders, keep on reading – it’s always good to refresh your mind of the basics to keep you anchored to the foundations you trade from.
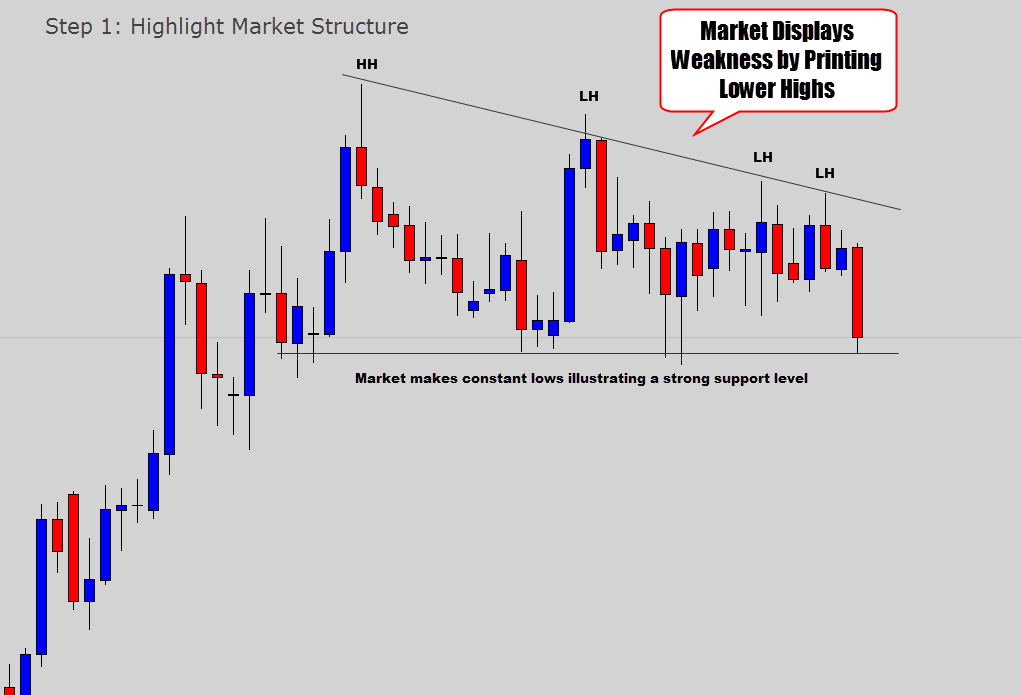
Step 1: Read The Market Structure
 I believe one massive hole exists in many trader’s decision making process – the inability, or the neglect to read the market structure before pulling the trigger.
Understanding market structure is basically tuning yourself in with the chart, and getting a good ‘read’ on “which way the wind is blowing”. It’s such a simple ‘back to basics’ skill, that many just lose touch with.
Even though market structure is basic technical analysis, it’s very important – you need it embedded into every trading decision you make.
For those who don’t know what I mean when I say ‘market structure’ – don’t worry it’s really simple.
Market structure is interpreting the arrangement of high and low points of price on the chart, or to be put more bluntly – it is the technical analysis of the combination of: higher highs (HH) and higher lows (HL), or lower lows (LL) and lower highs (LH) – which are sometimes referred to as swing highs or lows.
The order in which new highs or lows occur, can give you a very solid foundation to determine where the market is moving to, or not moving to…
Basic structure analysis will help you identify things that most traders surprisingly struggle with – allowing the price action to communicate to you if a market is:
- In a Bullish Trend
- In a Bearish Tend
- Ranging Between Two Levels
- Emerging into a New Trend
- Forming a Major Bottom to Top
Summary
By following the swing high and low points on a price chart, you can build a good foundation for your technical analysis. Many traders overlook the structure of the market, and therefore struggle with simple things like determining when the market is trending, or where the market is moving to.Identifying Trending Structure
Everyday, the same question pops up – How do I identify the trend?
This is such a simple hurdle that barricades too many traders from advancing with their chart reading skills. Many try to use complex indicators, or mathematical indicators to tell them when a market is trending.
That’s completely unnecessary – don’t rely on software to tell you if a market is trending or not, it only takes seconds if you follow this simple rule.
A trending market is one that is making higher highs and higher lows – OR – a market that is making lower lows and lower highs.
It just seems to simple to be true right? Well trust me – that’s all you need to look out for to identify trending conditions. If you can identify this simple structure, you can identify a trend…

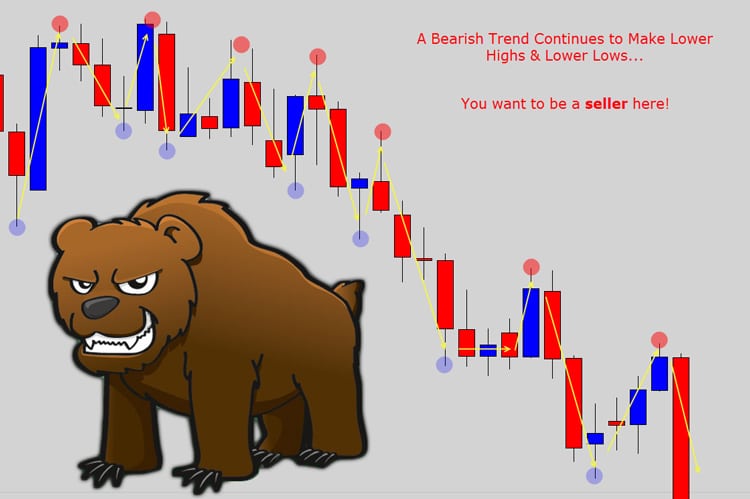
It’s almost like a connect the dots puzzle. Map out the major swing highs and lows, then connect them up, like I’ve done with the yellow arrows – and you will ‘see’ the trending structure.
Even though trending markets are the ideal conditions for making money, traders get so burned by them because they’re either trading in the wrong direction, or entering out of position
Remember, you want to buy low, sell high – so generally speaking, you want to wait for price to retrace into swing lows, or swing highs before entering the trend.
Don’t be the trader who chases price as it’s making new highs or lows, the next retracement will likely stomp you out.
Summary
Trending conditions are easily identified by connecting the swing highs and lows together, revealing a down stepping, or up stepping swinging motion of the market. New highs are being printed in a bullish trend, and new lows are printed in a bearish trend. Use retracements into swing highs or lows to enter trends at optimal position.Ranging Market Structure
Ranging markets can be really easy to see, and other times a little more difficult. The problem with ranging conditions is they’re a neutral ‘anything goes’ kind of sideways market – creating an undesirable trading environment.
In a text book scenario – ranging markets occur when price is trapped between two major levels – so you continuously see high and lows printed at the same horizontal levels…

Everyone knows the text book range structure – but this rarely occurs in every day markets.
Ranges are normally messy and turbulent, and don’t have clearly defined upper and lower boundaries. Generally you will have to identify the range by marking swing points that occur in the same area…

Notice how different the ranging market is in the chart above. This is a more realistic example how ranges normally behave, and why they can be so difficult to trade.
Because there is no clearly defined top or bottom, it makes it hard to pin point reversal trades. As you can see, price gets very noisy around the range boundaries – which is why you must be cautious when trying to trade these ranging structures.
The more clearly defined the range the better. Some ranges are just so noisy, it’s not worth the risk
Summary
Ranging market structure is pretty straight forward – just highlight the extreme swing points which acted as the turning point for price. Don’t expect this to be as easy as the text book examples – ranges can get very noisy and use ‘general areas’ rather than strict levels as turning points.Unreadable Market Structure
To finish off the discussion on market structure, there is one very important thing you need to know – something that traps a lot of traders and becomes a huge black hole for money.
You can’t make sense of all market conditions!
There are some charts which are so crazy, their market structure doesn’t make sense. If you can’t get a read on the situation, then it’s probably not worth trading at all.

Sometimes there is absolutely no explanation for erratic price behavior. Even after following the swing points and highlighting the market structure – there is nothing going on here.
Don’t be the trader who thinks they can analyse, and ‘beat’ the market under any conditions –it will lose you a lot money if you attempt this! Wait for the conditions to clear up and you will be able to enter the market with more confidence, achieving better success.
Summary
Sideways markets can be a chaotic environment that does not make any sense. Don’t feel ashamed for not being able to read every single market condition – if you can’t read the market structure correctly, then don’t put your money behind it.Step 2: Identify Likely Turning Points
After you get a read on the chart situation, you should know what direction you want to be trading – that’s if you want to be trading at all.
The next critical thing to do is to find the most likely place price is going to turn around. This is where we step up our technical analysis and use things like horizontal levels and trend lines.
Other traders may use additional technical turning points such as:
- Fibonacci levels
- Pivot Points
- Psychological price levels like ‘big round numbers’
But just for the record, I don’t use any of the above in my technical analysis. I stick to the very basics, and it serves me well.
To start building a case for a high quality, high probability trade – find those logical, proven turning points on the chart. Allow me to demonstrate this with simple, but powerful support and resistance analysis.
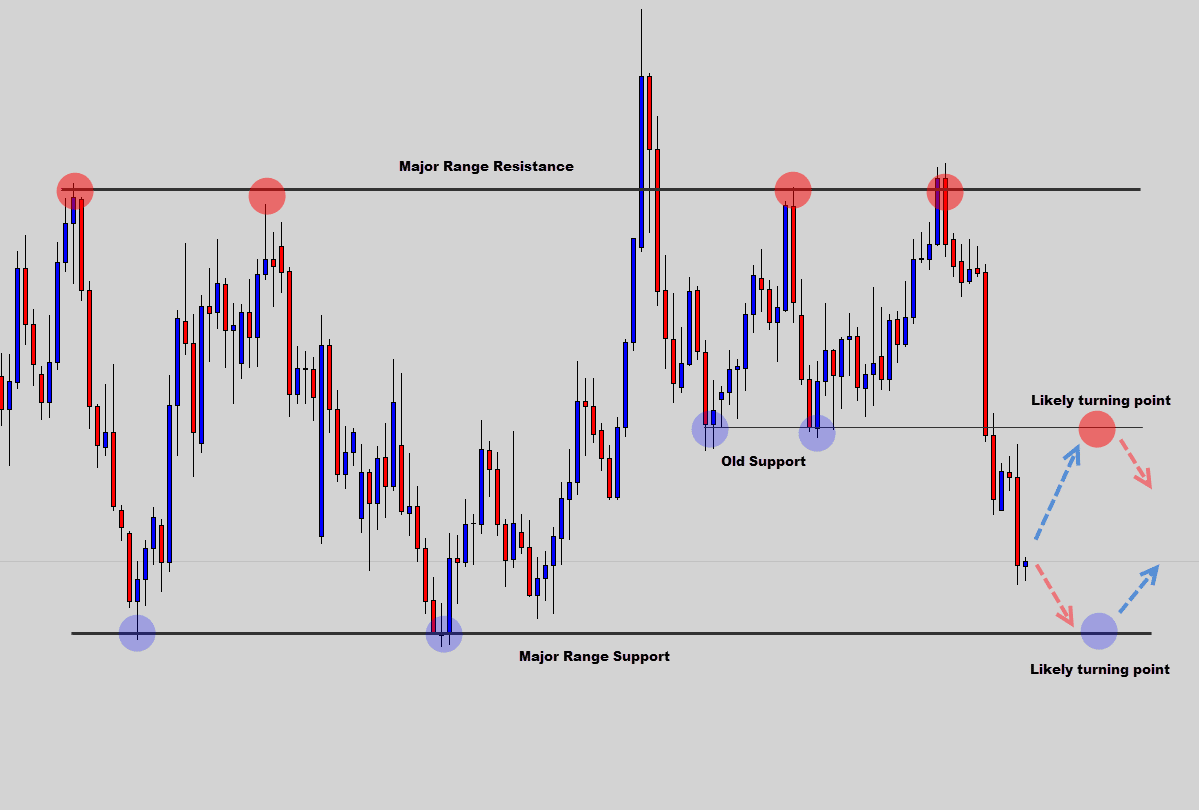
In the chart above, we identify the market structure and use support and resistance level to highlight potential turning points.
Now, anything can happen in Forex at any time – but there are two highly probable scenarios here…
- Price will retrace into the old support, and use that as new resistance and reverse there
- Price will continue to sell into the major range support level, where we will most likely see price turn around – or at least ‘bounce’ off.
Remember how I said most traders usually get burned by trends, because they trade out of position? Follow the chart example below for a classic example…
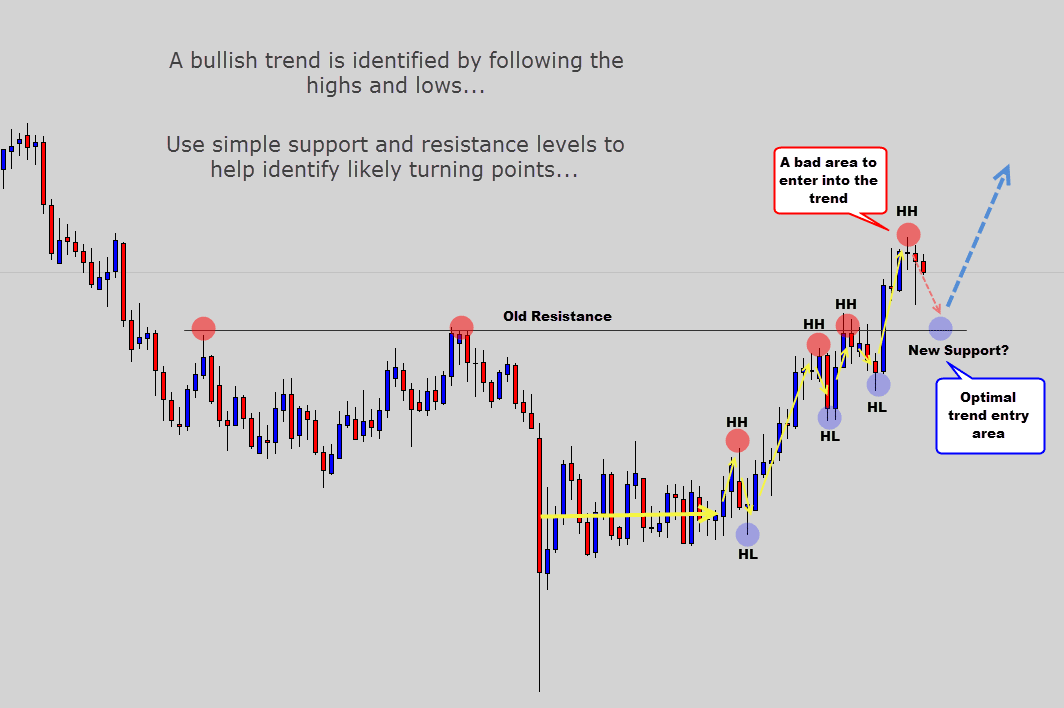
The example above shows how market structure and simple technical analysis can help you really start to master your chart reading skills.
We identify up-trending conditions and also mark out important support & resistance levels to pin point likely turning points. We can see that the current position of price is in a bad position to consider buying into the trend – this is how traders lose their money by trend trading incorrectly.
They believe “well, the trend is up, so I will start buying”. It’s called chasing price or buying out of position – learn how to enter a trade correctly.
By following the market structure like I showed you in step 1, we know that price is likely to retrace soon, and correct into new lows.
This is where the saying “buy low – sell high” comes into play. It means to use the trend’s retracements to our advantage, and always get into the trend at a smarter price.
Sometimes support & resistance levels don’t make sense to use – so you have to adopt a trend line from time to time. I try to be very minimalistic with trend lines – because it’s very easy to get carried away.
In most cases you only ever need to have one on your chart to do the job…
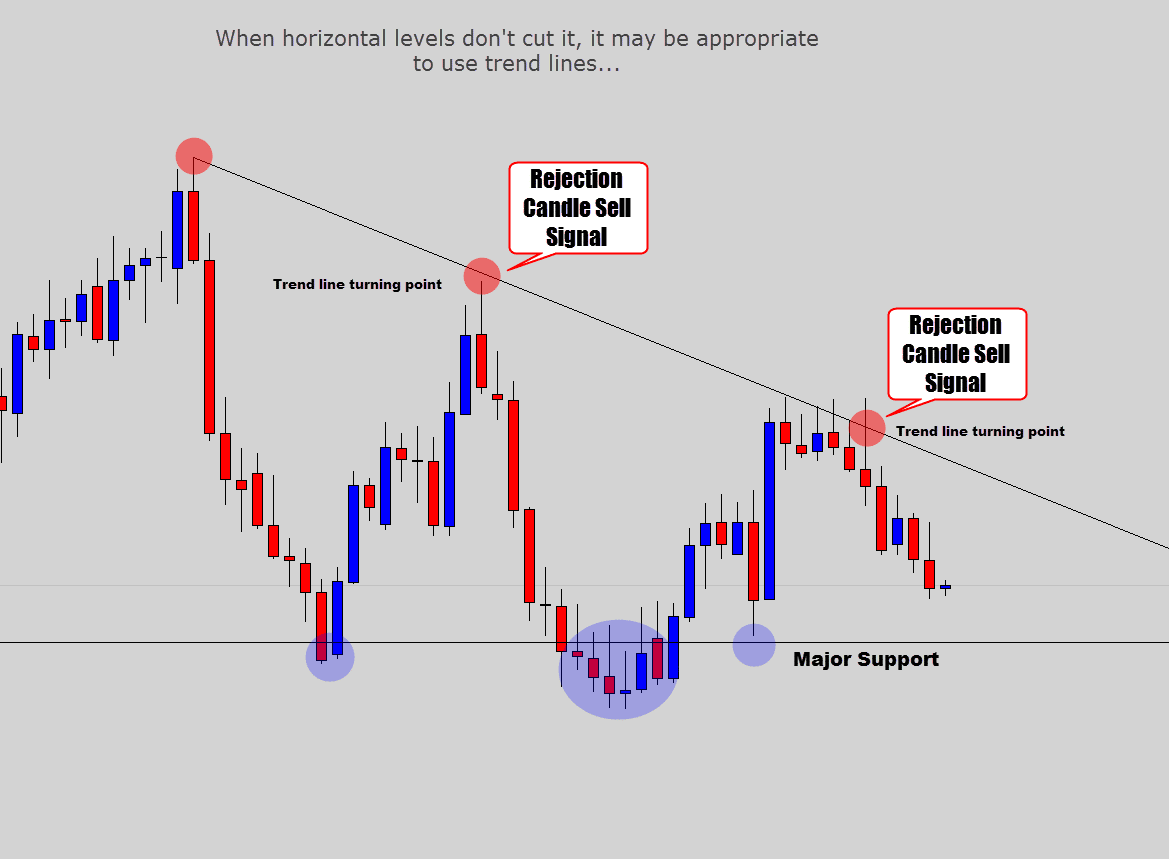
Notice in the chart above, a declining trend lines was the main turning point – illustrated easily by the major swing highs printing lower highs each time.
There were a few price action sell signals off the trend line turning point, which did turn out to bevery lucrative trades.
Summary
Your most successful trades are going to stem from technical reversal points on the chart. How many times have you taken trades in the middle of nowhere and then gotten stopped out? Instead, focus on the obvious turning points and use your favorite technical tools to mark the likely place(s) price is expected to bounce or reverse, to give your trades a better chance of success.Step 3: Wait For A Trade Signal
The final piece of the puzzle is to actually wait for a buy or sell signal from your trading system. If you’re trading naked price charts, then this is most likely going to be in the form of a candlestick reversal signal, or a breakout catalyst pattern.
The most common candlestick signal is the Rejection Candle, and the best trigger signal for learning to trade without indicators.
To sum up this guide – I am going to bring all the steps together and use a Rejection candle as an example for our trade signal.
So we highlight our market structure…
Remember to ‘read the chart’ by following the swing highs and lows. Let the chart communicate to you what it is trying to do.
We can see this market is currently in consolidation – I am not a big fan of trying to trade inside consolidation structures, so the best thing to do is to wait for a breakout before taking further action.
Once a breakout occurs, and the chart provides more promising price action – then move onto step 2, and identify potential turning points to anticipate market reversals.

Then you need to patiently wait for your trade idea to come to life. The market isn’t always going to give up a signal, but when it does – don’t think about it too much, take action.
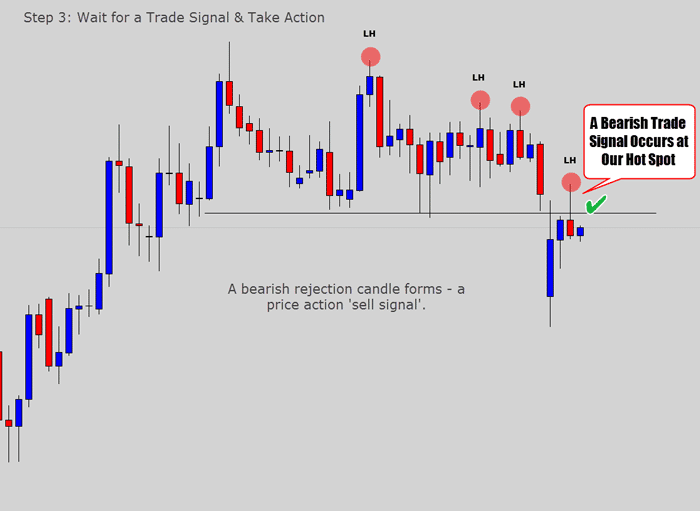
After being disciplined and patient enough to wait for all the steps here to align – we finally get our sell signal that checks the last box.
In this case, a bearish rejection candle forms right where we wanted it to. The key to price action trading, and trading Forex without indicators is not to think about things too much. Keep trading simple by following these 3 steps:
Make yourself a check list –
- Step 1: Read the Market Structure The market is weak, and trending down because it’s now making lower highs and lower lows – so we know that we want to be a seller in this market.
- Step 2: Identify Likely Turning Points Using simple support and resistance analysis, we identify that a likely turning point would be the old consolidation support since it was such a strong level. If it holds as resistance, the market will most likely reverse here.
- Step 3: Wait for a Trade Signal In this scenario the chart printed a bearish rejection candle, which is a common price action sell signal. The anatomy of the sell candle looks good, it’s large in range and the close price was below the open price – giving the candle a bearish body (this is something I like to see on my rejection candles).

As you can see this trade worked out very well – consolidation breakouts generally do create explosive moves like this, if the market offers up a signal to catch them.
If you’re getting frustrated with the markets at the moment, and feel like the situation is always turning against you – you’re probably skipping one of these 3 vital steps.
Here is what can happen if you skip, or don’t include any of these setups in your technical analysis…
- Market Structure: If you neglect to read the structure, you could simple enter very bad markets and get caught up in very undesirable turbulent conditions.
- Identify Turning Points: A lot of traders enter the market ‘out of position’, like selling low, or buying high. Wait to buy those higher lows, and sell the lower highs – use turning points such as horizontal levels/trend lines to anticipate these swing points.
- Trading Signal: Some traders will do something called ‘touch trading’, which is blindly buying or selling the market without a signal. This can work if you align step 1 & 2 together nicely, but having a trade signal basically confirms the trade idea and gives it a better chance of working out.
Write these steps on a piece of paper, create a checklist – or even better, include them in your trading plan. This will help straighten up your trading, and keep you away from those bad signals, or ‘in the moment’ impulsive decisions.
I hope this guide is going to help your trading – I personally follow this 3 step rule when I look at charts. Once you apply these 3 steps over and over, eventually it will become second nature, and you will be able to spot high quality trading opportunities within seconds.
If you would like to learn more about reading price charts, price action trading or my swing trading strategies – please check out our War Room for traders. We offer a price action trading course that extends on this lesson and gives you a deeper understanding of reading charts, timing your trades better and teaches you more trading signals.
Please leave your comments below – they are inspiring to me, and give me the positive feedback that motivates me to create more content like this for you guy
source;http://www.theforexguy.com/trade-forex-without-indicators/
Post a Comment