Parabolic SAR and ADX Strategy – Intro
The ADX Indicator is used as a reliable gauge to determine the strength of the trends. For traders, this means that the ADX indicator often signals potential trading opportunities where price tends to be at the strongest part of its trend. When applying the Parabolic SAR to the equation, it makes for a reliable trading set ups in the market where traders can exploit the short term momentum based trend set ups. The Parabolic SAR and ADX trading strategy is ideal for scalping and the trading strategy works across all time frames. It is up to the trader to decide which time frame works best for them. In this trading strategy, we make use of the PSAR with the default settings of 0.02 step, 0.2 maximum while the ADX is configured to 30 periods with only DI+ and DI-.
Parabolic SAR and ADX Strategy – Buy/Sell Trading Rules
PSAR – ADX Buy/Sell Signal Examples
Buy Signal Example

Parabolic SAR and ADX Strategy – Buy Signal
The chart above illustrates a PSAR ADX buy signal set up. First, the ADX Indicator signals an uptrend with DI+ crossing above DI-. The Parabolic SAR is in a buy signal mode already. However, we notice that price starts to move a bit lower with the PSAR now signaling a downtrend. Pending long order is placed at the PSAR level, which is triggered after two sessions, highlighted by the rectangle. The stops are placed at the low of the candle session where the long position was triggered. The stops are then trailed according to the PSAR levels and eventually, the long position is stopped out for a fairly decent profit.
Sell Signal Example

Parabolic SAR and ADX Strategy – Sell Signal
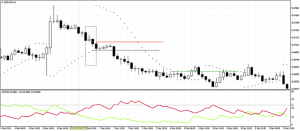
In the example above, we can see that the ADX indicator has signaled a downtrend. However, the Parabolic SAR still remained in a buy signal with the PSAR continuing to plot the reversal levels below price. A short position is trailed at the PSAR level, which is eventually triggered. By the time the short position is in play, the trend is already strong and price continues to move lower. Stops are initially placed at the high of the candle and then trailed to the subsequent PSAR levels. A few sessions later, the short position is closed out with price breaking the trailing stop near the PSAR level.
Parabolic SAR and ADX Strategy – Short Term Momentum Trading Strategy
As illustrated, the Parabolic SAR and the ADX trading strategy is one of the most simplest and uncomplicated of trading strategies. Because trades are entered when the trend is the strongest, based on the ADX Indicator, and the relative tight stops that come with this trading strategy, the profits far outweigh the risk ratio with the PSAR and ADX trading strategy. The simplicity of this trading strategy ensures that even beginners can find it easy to get accustomed to this trading strategy.
SOURCE;http://www.forexstrategieswork.com/parabolic-sar-and-adx/


Post a Comment